2018-07-31 Smart Seven Stars (IV)
Class One: First Class Software
2018-07-31 Smart Seven Stars (IV)
Best Number One Interactive & Comparative Scorecard.
What kind of decisions do we need to take at our Hotel?
The current situation is constantly changing, and a hotel must know, immediately, what actions should be taken at every moment. And, for doing this, it is a must to have the necessary information available, immediately and easy to understand.
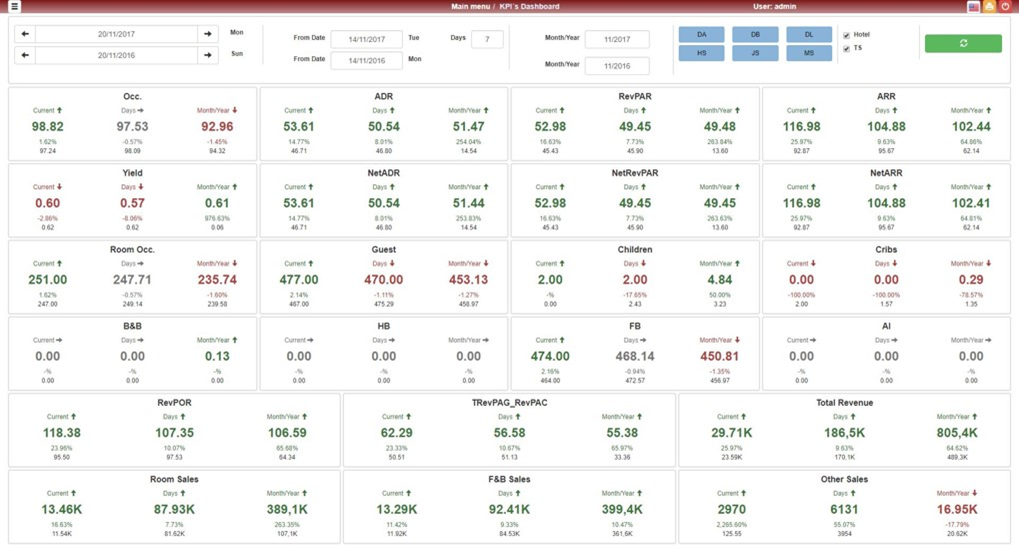
Class One is proud to present, in a single Dashboard, 22 KPIs that collate all of the necessary information to be considered for decision making.
| KPI's Dashboard |
|
|
The screen is an actual KPI example |
|||
|
|
|||
|
OCC the percentage of available rooms or beds being sold for a certain period of time., ADR, Average Daily Rate, RevPAR, Revenue Per Available Room, RevPar is a very classic KPI and regarded as one of the most important financial calculations for any hotel to see how much revenue they have made within a certain period of time. ARR Total Revenue Per Available Room preview of the total revenue from all departments which the room can generate. While RevPar only takes account of the revenue generated by the rooms, Yield factor that refers to the Rate Rack Rate, NetADR. Net ADR (except that it factors in the net revenues), NetRevPAR Net Revenue Per Available Room metric is similar to RevPAR, except that it factors in the net revenues (meaning that it accounts for distribution costs, transaction fees and travel agency commissions), NetARR, Occupied rooms, Guests, Children, Cribs, Guest Bed & Breakfast, Guest Half Board, Guest Full Board, Guest All Include, Guest = Guest Bed & Breakfast + Guest Half Board + Guest Full Board + Guest All Include + Guest Only Room, RevPOR. Revenue Per Occupied Room Total Revenue / Total Rooms Occupied, RevPOR, unlike RevPAR, considers revenue per occupied room which gives you a better understanding of how much profit you make from the guests who actually stay at your property. TRevPAG - RevPAC. Revenue Per Available Customer Total revenue generated by a single customer. It is calculated by dividing the segment total revenue and∕or the ASA by the number of customer, Total Revenue, Revenue Room Sales, Revenue F&B, Revenue Others |
Example: The figures we have got for yesterday can be compared against the same day last year (or, if yesterday was a Tuesday, against the same week’s Tuesday, last year), last week can be compared against the same week last year (or two different periods of time such as Easter, even if they haven’t happened at the very same moment), last month can be compared against the same month last year, etc. A date in the future can also be compared against its equivalent for another year, week, 10 days period, month... These values can always be set by the user and, therefore, dates can be in the past, present or future (Forecast Reservation)
|
||
E-Mail: comercial at classone dot es


